LLS - Appendix B: SR830 Lock-In Interface Program
All pages in this lab
- Low Light Signal Measurements
- Introduction to Equipment (LLS)
- Introduction to Noise
- Measuring the Light Signal from a Diode
- Appendix A: SR760 FFT Interface Program
- Appendix B: SR830 Lock-In Interface Program
- Appendix C: the Remote Control Box
- Appendix D: the Phase Sensitive (Lock-In) Detector
- Appendix E: Interpreting the Data Sheet for the LED and Photodiode Data Sheet
Contents |
Instructions for LLS SR830 Lock-In Interface Program
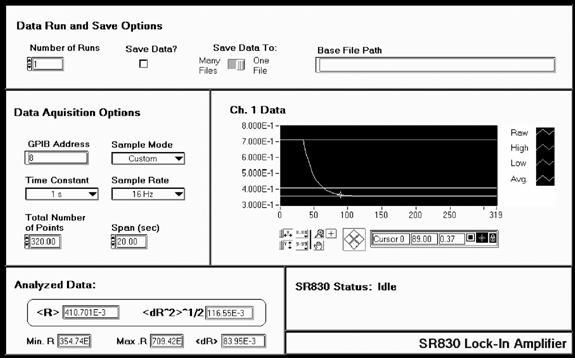
Shown above is a screen capture of the SR830 Interface Program. Following are descriptions of the various controls and displays grouped according to their location on the front panel.
Data Run and Save Options
- Number of Runs Control: Specifies the number of runs the Lock-In is to complete.
- Save Data? Check Box: If the box is checked, each data run will be saved at the end of the data run in a spreadsheet-ready file (tab delimited). If more than one run is to be performed, the data will automatically be saved.
- Save Data To Switch: Selects whether or not each data run will be saved in its own file or if all the raw data will be saved to the same file. Note: The processed data (i.e. ) will always be saved to one file.
- Base File Path: Displays the base file path. After entering the Data Run and Save Options, you will be asked for a base file path if the Save Data option was checked. What the base file path does:
- Raw data saved to one file will be saved under the file name:
[base file path] (T = [time constant ] ).xls
- Raw data saved to multiple files will be saved under file names of the form:
[base file path] (T = [time constant] Run [run number ] ).xls
- Analyzed data will be saved under the file name:
[base file path] Analyzed Data (T = [time constant ] ).xls
Data Acquisition Options (refers to each run)
- GPIB Address Control: Specifies the GPIB address of the SR830. Unless it is manually changed on the SR830, it should be 8.
- Sample Mode Ring: Selects which mode will be chosen.
- Custom mode allows the user to set both the time constant, sample rate, and span as desired (unless the total number of data points exceeds 1400).
- Best Choice allows the user to select only the time constant. The Interface program will then automatically set the sample rate (about $\large \frac {10}{Time Constant}$) and the span (adjusts it so that 1400 data points are taken).
- Span Control: Determines how long, in seconds, the SR830 will collect data for each run.
- Total Number of Points Display: Displays the total number of points the SR830 will collect during each run.
Analyzed Data
- <R> Display: Displays the average value of R ($\bar {R}$) for the latest set of data.
- <dR^2>^1/2 Display: Displays the rms deviation of R for the latest set of data. I.e.
$\large \left \langle dR^2 \right \rangle^{1/2} \leftrightarrow \sqrt {\frac {1}{N} \sum_{i=1}^N (\bar{R}-R_i)^2}=\sqrt {\bar{R}^2 - \bar{R}^2}$
- Min. R Display: Displays the smallest value of R in the latest set of data.
- Max. R Display: Displays the largest value of R in the latest set of data.
- <dR> Display: Displays the average deviation from <R>. I.e.
$\large \left \langle dR \right \rangle \leftrightarrow \frac {1}{N} \sum_{i=1}^N \left | R-\bar{R} \right \vert$
SR830 Status Ring
Displays the status of the SR830, the Interface program, and their link. The messages are pretty self-explanatory. During data acquisition, a fill slide will display the progress of data acquisition.
Ch. 1 Data Plot
- The plot will display the most recent data points in cyan, the average value of the data in green, and the high and low values in dark blue.
- The cursor control allows the user to investigate the raw data values. To use it, click on the \[+\] key on the control palette. For more information on plot displays, see LabView for Everyone.
- The x-axis has units of data point number, while the y-axis has units of Volts.