Written Report Guidelines
Contents |
Sample Reports
Bubble Chamber archived experiment
Bubble Chamber Film Analysis; Sample 111-Laboratory Write-ups
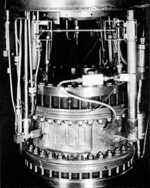
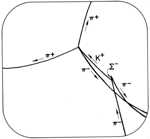
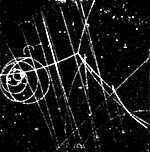
This experiment provides an introduction to elementary particle physics. Interactions and decays of a beam of K- mesons are studied in photographs taken in three stereoscopic views of the Alvarez 72-inch bubble chamber at the Berkeley Bevatron. The total interaction cross-section, mean lifetime, and a branching ratio are measured. Interactions observed are inelastic charge exchange, hyperon production, 4-prong interactions, and several decay processes.
A second set of photographs portrays the interaction of high energy photons with protons in the bubble chamber. This is an exploratory and qualitative experiment in which you observe many particle tracks and learn to identify and classify various interactions and decays, and determine their relative frequencies of occurrence. It's like a treasure hunt with all the excitement of finding something new and very different from ordinary experiments. It is an "observe and tell" experiment. There are no charts or plots or extemded mathematical computations required.
Note: Writing a good lab report is quite different than completing a typical physics problem set or writing an essay for a humanities or social studies class. Rather, what we are expecting is something approaching the format, content, and tone of a research paper, which you might find in a peer-reviewed journal. Since many of you have probably not composed such documents before, we have included for your use several laboratory reports which were written for the now-retired Bubble Chamber experiment. We suggest that you peruse the laboratory manual to get a sense of what the experiment must have been about, and then read through some of the sample reports. Don't feel obliged to follow the format of these reports or to emulate their style. Rather, use these reports by paying attention to the level of detail, the tone of expression, the level of formality, the structure of the report, and whether the discussion appears to you to be clear and placed in context. Consider these same issues when reading through your own reports prior to turning them in.
 |
 |
 |
Examples of graded Bubble Chamber reports;
Overview
Your report should show a clear understanding of the experiment and the work that you did in the laboratory. It should not be longwinded, it should not include all possible details, and it should not be a scattergun approach. Fifteen pages of text (excluding data, graphs, etc.) are a reasonable upper limit on length for any report. (Please note, however, that this “upper limit” does not mean that your report should stop just because you have hit page 15—see “Analysis” below.) Your report should concentrate on the essentials, and should show that you know what you are doing and that you can pick out the significant details. It should also show that you know how to organize a report—each experiment write-up will give you some guidelines, but we want you to exercise your judgment. You should compromise between telling so little, as to be not understandable, and telling so much that you are following a cookbook. These reports should be halfway between a Physics 7 report and a research report; they should not read like problem sets. Try to include the answers to any questions posed in the lab manual in the body of your report where they make sense; if they do not fit in anywhere, place them in an Appendix at the end.
Level
Your report should be written at a level such that one of your classmates with the level of understanding that you had before you started the experiment could pick up your report and understand what you did, what physics is illustrated, and how good your results are.
Format
Your report should be double-spaced and easy to read—typed or word-processed unless your handwriting is exceptionally good. Spend your time on physics, not on decorating your report. If your word processor won’t incorporate graphics and equations trivially, don’t waste your time. Leave a blank space for them and draw them in by hand (see Figure 1 and Eq. 1).
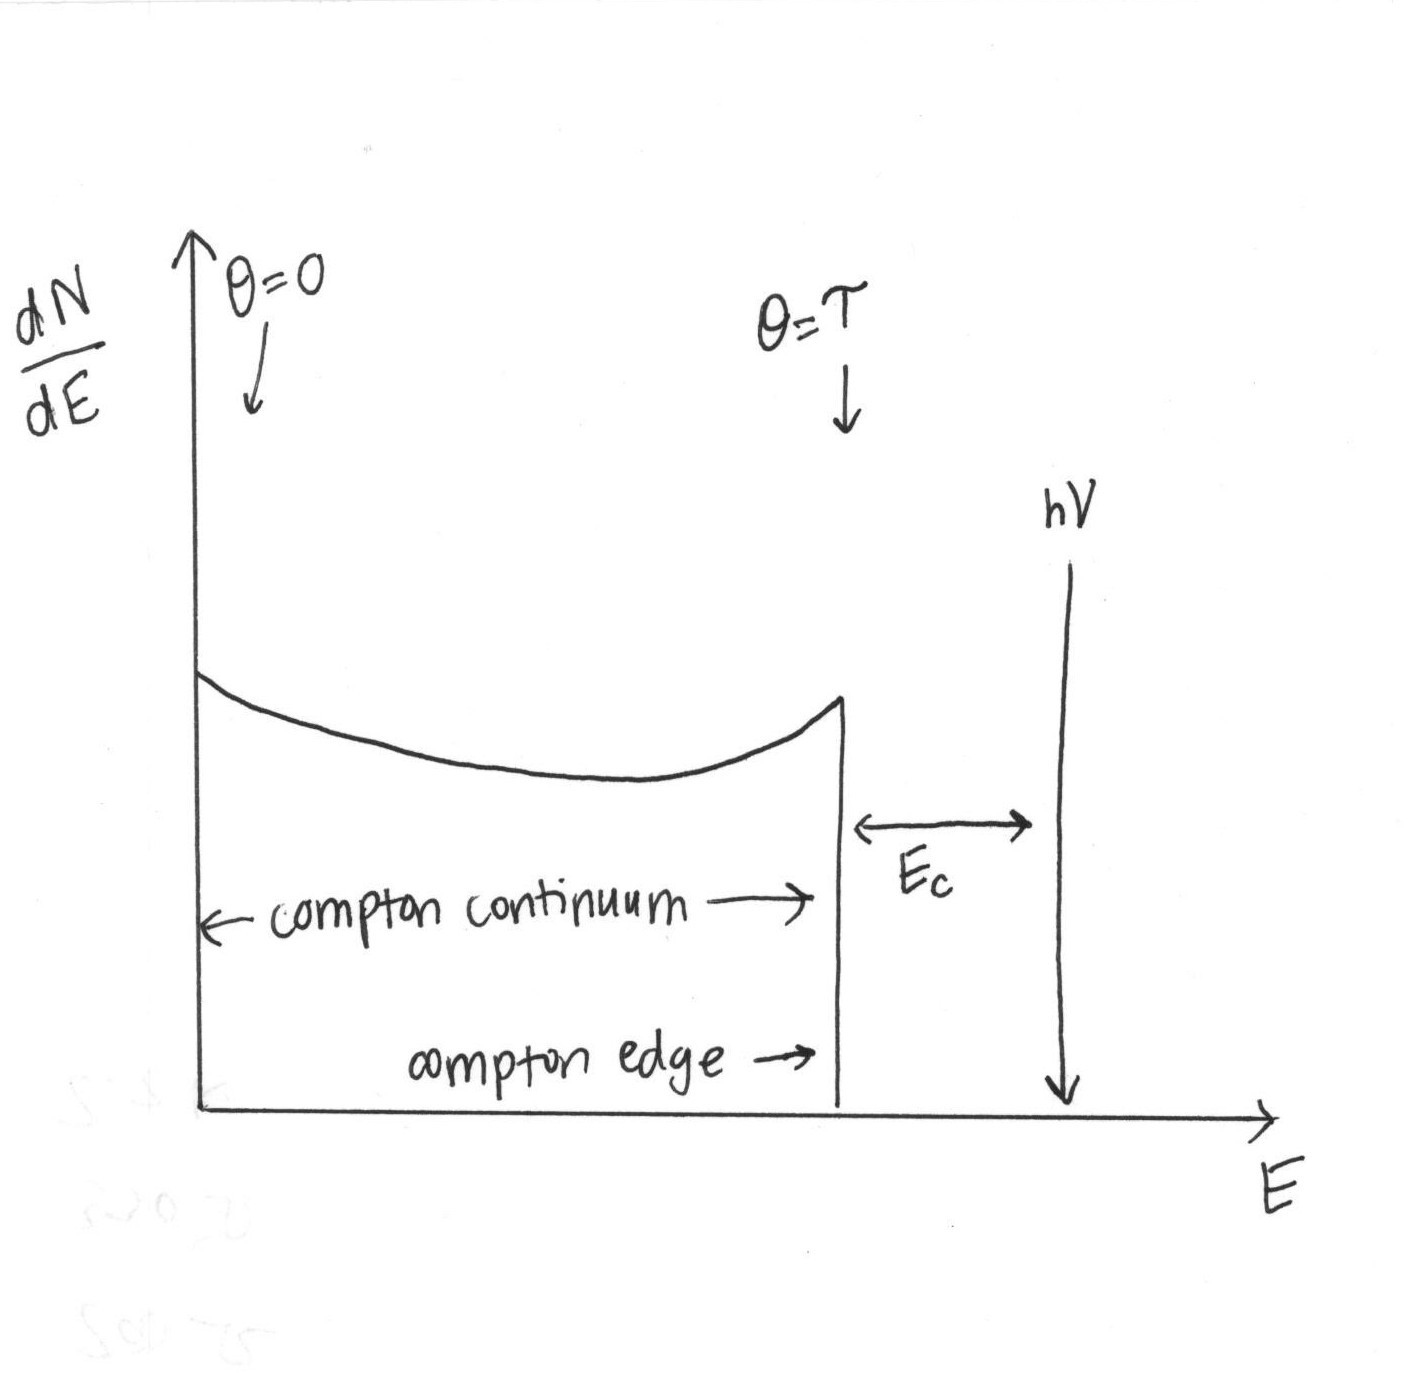 Figure 1: A simple hand-drawn graph Click here to see larger picture |
The diagrams, (small) data tables, plots, and graphs necessary to make what you are saying as clear as possible should be included in the body of your report, not relegated to an appendix (most data analysis packages allow you to copy and paste their graphs into a word-processing document). Be sure to carefully label everything: title of graph, scale of axes, physical units of numbers etc. Please remember that all graphs, diagrams, and as well as text in your report must be your own. If you wish to include material from other sources (for instance the 111-webpage or a publication) make sure you indicate the source of it by citing it. For instance, you might add in the Figure caption: Figure taken from Ref. [xxx], and then list at the end of your report the details for that reference. However, note that you cannot share any graphs, diagrams, or text with your partner.
Your report should be written on blank white paper. Then submit it online at Bcourses.
Proofread your report before you submit it; it is very distracting to constantly encounter typos and grammatical errors.
Your report should be submitted typed and online to Bcourses with the title of the experiment, your name, and the date on the front of your report.
Your report should include:
- Title Page: The first page of your report should be the signed Pre-lab Discussion page.
- Abstract: This should be a brief (100 words) statement of the experiment (what is it?) and your conclusions (what did you do with it?). Be sure to include your final results, along with their associated errors.
- Introduction: This should describe the physics and give an overview of what you are going to do. Aim to answer the questions: Why would someone want to do this experiment? What is gained?
- Theory: Include the working equations that you will be using but do not include lengthy derivations (such as the Compton or Rutherford formulas) unless specifically asked. Instead concentrate on explaining what the equations mean, something another student could understand if you were at the chalkboard talking. Do include a few sentences on where the equations come from and what they are dependent on, (assumptions, conservation laws, etc.), and also cite a reference where the derivations may be found.
- For example: In the Optical Pumping experiment your theory section should start with an energy level diagram of the rubidium atom, (and not energy levels of a hypothetical atom as described in "Scientific American"). Everyone in the 111-Lab has studied some quantum mechanics, and so understands what energy levels of real atoms are like in principle, if not in detail. This should be followed by a discussion of what pumping is and how it is done, while referring to the energy levels in the diagram. An explanation of where the RF transition is and how it is induced should follow, again showing on the diagram which energy levels are involved. The derivation of the Breit-Rabi law is specifically called for as well and so should be included, along with a brief explanation of where it comes from, what assumptions are made in its derivation, and what it relates in its final form.
- Apparatus and Procedure: You should have enough detail so that one familiar with physics but not with the particular experiment at hand could reproduce your experiment if necessary. A block diagram of the equipment is essential. Explain the major pieces of equipment and what they do, but do not overwhelm your reader with details here!
- Calculations and Data Reduction—Analysis: Matlab is available in the 111-Lab and we encourage all to learn and use it. This section really is the heart of your report, so you would be wise to start it early. When doing this part of the lab, bear in mind that the calculations that the lab manual asks you to do are supposed to act as a guide to your analysis, and not as a series of separate calculations. Do not simply present results without commenting on them; we are confident that by now you can successfully plug into equations and find numerical results. It is the analysis of these results that we are after: do your results agree with what you predicted? Tables and graphs are essential here, along with comments on whether your values fall within the range of the predicted values or follow expected trends, etc. And of course, as in all experimental work, it is possible that on occasion your results will not agree with what you expect. In this case you should offer some explanation of why you think your results are not as you expected. Overall it should be clear to the reader why it is that you are doing what you are doing, and what it is that you find. **Emphasis should also be placed on the calculation of reasonable error figures for all measured results. You must consider what factors limit your accuracy, and how these factors limit your accuracy. (Which factors dominate? Are they all significant?) You should realize that a value reported without an associated uncertainty, be it a data point or a final calculated value, is rendered meaningless. When you quote an uncertainty with a final value, you should make it clear to your reader how you generated this uncertainty: is it a standard deviation or a propagation of uncertainties in measurements? Again, it is important that your reader is easily able to follow what it is that you are doing, and why you are doing it that way.**
- Conclusion: Whatever else you want to say should be included here. What did you do and find? Please include a few words on what you think about the experiment and how it can be improved: by the time you write your report, you are the expert and so it is your opinion that would be most helpful.
- Acknowledgments/References: If you took data with a partner, say who your partner was. Also acknowledge the use of someone else's computer program, derivations, etc., as well as whatever texts you used as references. Note: References should be in the format such as e.g. that of Phys. Rev. A or Phys. Rev. Letters.
- Raw Data: You must include the data that you took in lab in an appendix; the data should be clear enough so that someone could look at it and determine what you measured and how you measured it. You should be keeping a lab notebook, so simply photocopy all relevant pages. If you have acquired data electronically and the amount of data is unreasonably large, consider displaying it in a reasonable compressed format, such as graphs.
Your report should include all of the listed sections, along with the signed Pre-lab and Mid–Lab Discussion sheets with the answers to the pre-Lab questions.
Finished?
Finally, read over your report and ask yourself, "Is this what I would like to have in order to understand what this experiment is all about?" That is what we want from you.
Plagiarism
Both the University and the 111 Lab staff take the subject of plagiarism very seriously. Please make sure you understand completely the following and ask questions if ever in doubt:
"All data that you present in your reports must be your own. All written work that you submit, except for acknowledged quotations, is to be in your own words. Work copied from a book, from another student's report, or from any other source without proper citation will, under University rules, earn the student a grade of 'F' for the semester, and possible disciplinary action by the Student Conduct Committee."