LLS - Introduction to Equipment
All pages in this lab
- Low Light Signal Measurements
- Introduction to Equipment (LLS)
- Introduction to Noise
- Measuring the Light Signal from a Diode
- Appendix A: SR760 FFT Interface Program
- Appendix B: SR830 Lock-In Interface Program
- Appendix C: the Remote Control Box
- Appendix D: the Phase Sensitive (Lock-In) Detector
- Appendix E: Interpreting the Data Sheet for the LED and Photodiode Data Sheet
Contents |
The SR760 FFT Spectrum Analyzer
Before you continue further, you should first read the Analyzer Basics and Operation sections of the SR760 FFT Spectrum Analyzer Operating Manual and Programming Reference.
Experiment I
You will use a function generator to provide an input signal to the SR760 in order to get a feeling for how the SR760 and the function generator work. By using well-defined input signals, you can get a better feeling for how the FFT treats not-so-well defined signals. You will experiment with sine, triangle, and square wave input signals.
- Hold down the back arrow key, [$\leftarrow$], and turn on the SR760. This puts the SR760 in the default settings.
- Connect the output of the Function Generator to Signal In A of the SR760 with a tee and a 50 ohm terminator. Any value other than 50 ohms changes the calibrations of the SR760 internal parameters.
- Start with a sine wave input signal, say a 0.2 VPP (-20 dBV according to the SR760 units convention) at 400 Hz sine wave. The procedure for setting these values is as follows:
- To set the DS345 Digital Function Generator:
- Turn it on.
- Press the up/down arrow keys [$\triangle$] [$\nabla$] by the BNC FUNCTION OUTPUT until the sine waveform is highlighted in green. To select another type of waveform output, you just press the [$\triangle$] [$\nabla$] arrow keys until the desired waveform is highlighted in green.
- To set the frequency of the sine wave,
- Press the [ FREQ ] button.
- Enter a new frequency using the number pad and set it by pressing the appropriate units key-e.g. the [ Hz/Vpp] key.
- To set the amplitude of the output waveform,
- Press the [ AMPL ] button.
- Enter the desired amplitude using the number pad and set it by pressing the appropriate units key-e.g. the [ Hz/Vpp] key. Note the various choices you have.
- You might want to check that everything is working properly using a scope, if one is available.
- To set the DS345 Digital Function Generator:
- Now we need to make some adjustments on the SR760 to get a useful display. You want to look at the Fourier decomposition of signals in a small range that includes the signal of 400 Hz and several of its harmonics (multiples of 400 Hz). To do this, set the START FREQUENCY to 0 Hz and the SPAN to 1.56 kHz. These settings say that the range of frequencies you want to examine is from 0 to 1.56 kHz. If you don't already know how to do that, follow the instructions below.
- To set the Start Frequency
- Press the [ FREQ ] button in the MENU pad section on the front of the SR760
- Press the [ START FREQ ] soft key. A soft key is a button whose meaning changes, depending on which MENU key was pressed immediately before. All hand-held calculators have soft keys, for example. On the SR760, they're lined up at the right of the screen).
- Press 0 on the ENTRY pad. New menu shows up on the screen with choice of [ mHz ], [ Hz ], [ kHz ], and [ escape ]. Press the [ Hz ] soft key.
- To set the Span
- Press the [$SPAN\triangle$] / [$SPAN\nabla$] keys by the number pad until the appropriate span is set OR
- After pressing the [ FREQ. ] button, press [ SPAN ] soft key and turn the SPIN KNOB (the dial) until the span is 1.56 kHz. Note that 100kHz is a maximum value.
- To set the Start Frequency
- Now it's time to see what the SR760 is doing to the sine wave, so look at the display on the SR760. You should see a large peak at 400 Hz, the frequency of the input sine wave. Be quantitative and get a measurement to see if its frequency and amplitude are correct. To do so do the following:
- Press the [ MEAS. ] button in the MENU section. This will tell the SR760 that you want to measure something. The SR760 then re-defines the soft keys and the operation of the SPIN KNOB.
- Turn the SPIN KNOB until the marker (the little black square on the screen) is at the top of the main peak. Look at the top row center on the screen. It should read -20 dBV. Does it ? Remember that the instrument can display a signal in different units, such as Volts pp, Volts rms, decibel Volts (dBV = 20logV), etc. Acoustical and electrical engineers like to use decibels, while most of us like to use just plain volts. To familiarize yourself with these different units, go to the [ MEAS ] $\rightarrow$ [ UNITS ] menu and try out the different settings.
- You may notice that the peak does not lie exactly at 400 Hz, (top row left) but at some close frequency, such as 398.44 Hz. If so, is this a fault of the function generator or of the SR760? Experiment with different SPAN settings of the FFT, to measure the frequency more accurately.
- The DS345 is a good function generator. However, you may notice that there are also smaller amplitude sine waves whose frequencies are multiples of the 400 Hz fundamental sinusoid. These are called harmonics. The second harmonic is twice the frequency of the first harmonic or fundamental frequency sine wave. If you don't see any, try using the Linear Averaging (RMS) feature and perhaps increase the SPAN (don't spend too much time doing this-they may not be readily visible). The Linear Averaging feature takes many transforms and linearly averages them. See the SR760 operating manual for instructions on its use or just poke a few buttons. You might start with the [ AVERAGE ] button. If you have the opportunity, you might use an analog function generator from BSC to observe higher harmonics.
- If you see higher harmonics, does that mean the signal generator is not producing a perfect sine wave?
- If you don't see any higher harmonics, does that mean the signal generator is producing a perfect sine wave? Explain.
- Now experiment using different types of input waveforms. Look at the Fourier spectra of triangular and square waves. Note what you see on the screen for each waveform. Are they what you expect mathematically? Explain.
Optional Exercise for the FFT:
If you felt comfortable with the previous experiment, then skip to Experiment II. Otherwise, you can solidify your understanding of the FFT with the following exercise.
Examine a sine wave in the time domain with a oscilloscope and the frequency domain with the FFT
- Link the generator's function output to both the FFT input and the scope input. Remember a 50-Ohm terminator on the end of each wire connecting to scope and FFT!
- Configure the function generator to produce a sine wave with a 0.5 Vpp amplitude and a frequency of 4300 Hz. Using the scope make sure everything is working correctly. Procedure is as follows:
- Turn on the SRS DS345 Function generator
- To select a sine wave output: Press the up/down arrow keys, [$\triangle$] [$\nabla$], by the BNC FUNCTION OUTPUT until the sine waveform is highlighted in green. To select another type of waveform output, you just press the [$\triangle$] [$\nabla$] arrow keys until the desired waveform is highlighted in green.
- To set the frequency of the output:
- Press the [ FREQ ] button
- Type 4300 using the number pad
- Set the new frequency by pressing the [ Hz/Vpp] button
- To set the amplitude:
- Press the [ AMPL ] button
- Type 0.5 using the key pad
- Set the new amplitude by pressing the [ Hz/Vpp ] button
- In General: To select a frequency, amplitude, offset, or phase of the output wave:
- First press one of those 4 buttons in the FUNCTION area on the front panel
- Enter the desired value with the keypad.
- To make the new setting take effect press the appropriate units key in the right column of the ENTRY area.
- We want to set the SPAN of SR760 to 6.25 kHz and switch the display to linear magnitude:
- To turn on the SR760 hold down the back-arrow key, \[[[Image:LLSimage014.gif|thumb|250px|Title and Description]]\], on the SR760 FFT ENTRY pad and turn on the power. You should hold down the back-arrow key until all of the internal tests have completed and the FFT has started taking data. This starts the FFT in default mode. Note: occasionally you may see the FFT freeze and display the message: "Calibrating Offset." This is normal and nothing to worry about. Just wait until it's done before continuing.
- To set the SPAN
- Press the [ FREQ ] button in the MENU area.
- Press the top-most soft key near the monitor (the one corresponding to the span). 100 kHz should be highlighted in green. Note: if you pressed the wrong soft key, just hit the [ FREQ ] button in the MENU area and try again.
- Turn the SPIN KNOB counter clockwise until the highlighted number reads 6.25 kHz. The span has now been set to 6.25 kHz.
- To set the display mode to Linear Magnitude:
- Press the [ MEAS ] key in the MENU area.
- Press the soft key second from the top (it corresponds to DISPLAY). Again, if you hit the wrong soft key, just press the [ MEAS ] key in the MENU area and try again.
- You should now see the following choices on the screen: [ Log Mag. ], [ Lin Mag ], [ Real Part ], [ Imag. Part ], [ Phase ]. Press the soft key corresponding to [ Lin Mag ]. (the second from the top). If you make a mistake, just press the correct soft key. The FFT should now be displaying the linear magnitude of the Fourier components instead of their Log magnitudes. Notice how all the noise disappears (we will come back to this later).
- Now press the [ AUTO SCALE ] button located in the right column of buttons in the ENTRY section. This will re-scale display. You should now see a single peak on the FFT screen.
- If everything is working properly, you are now ready to examine a single sine wave in the time and frequency domain.
- Look at the sine wave on the oscilloscope. What you should see is a sine wave with an amplitude of 250 mV (0.5 Vpp) and a frequency of 4.3 kHz. If the amplitude is not what you would expect it to be, make sure you have a 50-Ohm terminator. As you know the scope is plotting the voltage output of the function generator as a function of time. It is representing the function generator's output in the "time domain."
- Now look at the FFT. First measure the position and amplitude of the peak you should be seeing. To do this:
- Press the [ MEAS ] button. This will change the SPIN KNOB's function.
- Dial the SPIN KNOB until the cursor on the screen locks to the peak. This should happen when the peak is between the two vertical dashed lines.
- Read the location (frequency and amplitude) of the cursor in the upper-left hand corner of the screen.
- You should find that the peak is located around 4.3 kHz and has an amplitude of about 250 mV. Note that the values may not be exactly 4.3 kHz and 250 mV. The reasons for this will be discussed later in the lab.
- A single peak on the FFT display corresponds to a single sine wave with a frequency and amplitude given by the height and location of the peak.
- Now vary the frequency of the sine wave and watch what happens on the scope and the FFT.
- Vary the frequency:
- On the DS345 Function generator, press the [ FREQ ] button. You should now see that the sine wave has a frequency of 4.3 kHz (the green FREQ should be lit up under the readout).
- Now press the [ STEP SIZE ] button in the MODIFY section. Now both FREQ and STEP should be lit up in green under the display.
- Using the [$\triangle$] [$\nabla$] arrows directly above the [ STEP SIZE ] button, adjust the STEP SIZE to read 100.000. This will determine how much the frequency will change when you press the [$\triangle$] [$\nabla$] keys later.
- Now press the [ FREQ ] or [ STEP SIZE ] button. The screen should read 4300 Hz and only FREQ should be lit up in green under the display.
- Now press the [$\triangle$] [$\nabla$] keys in the MODIFY section. The frequency reading should change in steps of 100 Hz since you have just adjusted the STEP SIZE to 100 Hz.
- Watch the peak move back and forth on the FFT.
- Vary the frequency:
- Now vary the amplitude of the sine wave and watch what happens.
- Press the [ AMPL ] button on the DS345 Function Generator. AMPL should be lit up in green under the main display which should read 0.500 Vpp.
- Now press the [ STEP SIZE ] button in the MODIFY section (STEP should light up).
- Using the keypad in the ENTRY section, enter .05 and set the value by pressing the [ Hz/Vpp ] key.
- Press either the [ AMPL ] or [ STEP SIZE ] buttons
- Adjust the amplitude with the [$\triangle$] [$\nabla$] keys in the MODIFY section.
- Watch how the height of the peak changes in correspondence with the change in amplitude.
- Now change the input waveform to a square wave and a triangle wave.
You should now have a fairly good idea as to how the FFT treats a pure sine wave and how to take simple measurements.
SR830 Lock-in Amplifier
Experiment II
This experiment is very similar to the previous one. In order for you to get a feeling for how the lock-in works, you're going to feed it a sine wave of known frequency and amplitude. Along the way you'll push some buttons and take some measurements.
- Turn on the SR830 while holding down the interface setup key (the ON-OFF switch is on the back by the power cord). Release the key after the instrument starts beeping. All the defaults will then be set. Turn on the DS345 Function Generator.
- Feed the Lock-In a sine wave with a frequency of about 1 kHz and 2 Vpp:
- Connect the FUNCTION output of the DS345 to INPUT A/I of the SR830 (remember the 50-Ohm terminator!).
- Set the DS345 so that it produces a 2 Vpp sine wave at a frequency somewhere around 1 kHz. To set the frequency press [ FREQ ], [ 1 ], [ kHz/Vrms ]. To set the 2 Vpp sine wave press [ AMPL ], [ 2 ], [ Hz/Vpp ]. In the FUNCTION section of DS345 press the [$\triangle$] [$\nabla$] keys until the sine wave function is lit. If you want to try out different waveforms at a later time, keep these things in mind:
- To avoid damaging the SR830, make sure the input voltage is less than 50 V.
- To avoid overloading the Lock-In, keep the input voltage less than 1 Vrms.
- To provide a reference signal with the same frequency as the sine wave for the SR830, Connect the SYNC output of the DS345 to the REF IN of the SR830 (you don't need a 50-Ohm terminator here).
- Now make sure that the settings are all right.
- You'll probably want to measure the magnitude of the signal, so set the CHANNEL ONE DISPLAY of SR830 to R (magnitude of signal) and the CHANNEL TWO DISPLAY of SR830 to $\theta$ (phase angle between the input signal and reference signal). To adjust these, hit the corresponding [ DISPLAY ] buttons.
- Verify that the reference frequency is the same as the input frequency by pressing the [ FREQ ] button under the REFERENCE WINDOW (you should see the reference frequency displayed in the window above the SPIN KNOB). If it is not, press the [ SOURCE ] button by the SPIN KNOB so that the reference signal is switched off of INTERNAL (the SR830 also has its own internal oscillator you can use if a reference signal is not available).
- Adjust the SENSITIVITY to fit the level of the signals you are going to measure. The term "sensitivity" as used here by the instrument manufacturer means "set the detector to the maximum value of the quantity that you want to measure." For examples, if the signal is going to be 1 volt max, set the sensitivity to 1 volt. This is considered a large sensitivity. If the largest signal will be 25 mV, set the sensitivity to 25 mV. This is considered to be a small sensitivity! When the "sensitivity" is smaller than the signal, CHANNEL ONE displays an overload warning. Alternatively, you may not have the resolution you want. To adjust the SENSITIVITY, press the [$\triangle$] [$\nabla$] arrow buttons in the SENSITIVITY section of the SR830 until an appropriate value is attained. If your signal is a .2 Vpp sine wave, your sensitivity should be greater than 71 mV. Why? Remember that the SR830 displays rms amplitudes.
- Learn about the TIME CONSTANT from the Lock-In manual. For a signal with constant amplitude, a general rule is that the larger the TIME CONSTANT, the more stable the measurement. Why? Experiment with different time constants (remember that it takes 5 time constants for the signal to settle to 99% of its actual value). Would you want to maximize the TIME CONSTANT if you were trying to track a signal whose amplitude was varying? What would you have to take into consideration?
- Does the output roughly agree with what it should be? (Remember, the reading is in Vrmsnot Vpeak amplitude.). If the reading is off by a few millivolts, why?
- Now change the input waveform to a 2 Vpp square wave. To do that press the [$\triangle$] [$\nabla$] keys in the function section of DS345 until the square wave is lit. The SR830 Basics section of the manufacturer's manual states that you will measure not the amplitude of the square wave, but the amplitude of its fundamental Fourier component (or the amplitude of the Fourier component at the reference frequency). It also says that a 2 Vpp square wave of frequency $\omega$ can be written as $1.273\sin{[\omega t]} + 0.4244\sin{[3\omega t]} + 0.2546\sin{[5\omega t]} + ...$
The manual goes on to say that the SR830 locked to angular frequency $\omega$ will "...single out the first component. The measured signal will be $1.273\sin{[\omega t]}$, not the 2Vpp that you'd measure on a scope. What voltage do you expect the SR830 to display? Does it? Again you may be off by a few millivolts or so. The root to this problem is probably the "50$\Omega$" terminator resistor. If it's not 50$\Omega$, the desired output of the function generator will not be what is input to the Lock-In. The setup basically acts like a voltage divider: the function generator has 50$\Omega$ in it, and adjusts its output voltage to terminate into 50$\Omega$. So the larger the terminating resistance, the larger the input voltage to the Lock-In. If you remove the terminator entirely, the input voltage will be nearly twice what it should (the input impedance of the Lock-In is much greater than 50$\Omega$). Experiment with different terminators. The ones in back may range anywhere from about 52$\Omega$ to 81$\Omega$.
Experiment III
Now you're going to learn to use the interface software for the Lock-In. You'll also explore the effects and the role of time constants on measurements. Basically you're going to vary the input signal amplitude and see how quickly the Lock-In can respond. Read the entire procedure before beginning.
- Use the DS345 function generator to provide the SR830 with an input sine wave: 2 Vpp (we don't want to overload the SR830) with a frequency of 1 kHz or so.
- Set [ SLOPE/OCT ] to 6 dB on the Lock-In (by the TIME CONSTANT controls). This partially determines how "steep" the low-pass filter is (see Appendix D: the Phase Sensitive (Lock-In) Detector). We'll start out small (6 dB) and work our way up (24 dB).
- At this point, you may want to read Appendix B: SR830 Lock-In Interface Program for more detailed information about the workings of the Lock-In Interface program.
- Start the program LowLight SR830 Lock-In Interface by double clicking on its icon.
- Set the following data-saving parameters on the interface program:
- NUMBER OF RUNS: 1 (i.e. you'll only be taking one data run)
- SAVE DATA: Yes (check the box) (You will want to include a plot of the data in your write-up)
- Press [ BEGIN ]. The save window will prompt you to choose the base file path and name. Choose whatever you want (preferably to your own disk) and proceed to set the following operating parameters:
- GPIB ADDRESS: 8 (you shouldn't have to ever change this - it's just tells the computer where it can find the SR830.)
- SAMPLE MODE: Best Choice
- TIME CONSTANT: 300 milliseconds (we will want to change that later to 1s but because of a bug in the program preventing us to chose the SPAN we have to do certain operations first). This sets the SPAN to 19s (Time Constant and Span are linked in the Best Choice Mode). Now change SAMPLE MODE to Custom and the TIME CONSTANT to 1s.
- SAMPLE RATE: 32 Hz (the $\frac{Number of data points collected}{second}$).
- Press [ START ] (The computer should start taking data).
- A second or two after the program begins acquiring data, change the amplitude of the input sine wave to 0.02 Vpp. To do this quickly, input the new value for the amplitude on the function generator before you start the run, but wait to press the units button (i.e. [ Hz/Vpp] ) until you're ready (the function generator won't make any changes until everything's specified). The following figure shows what the output of the program might look like.
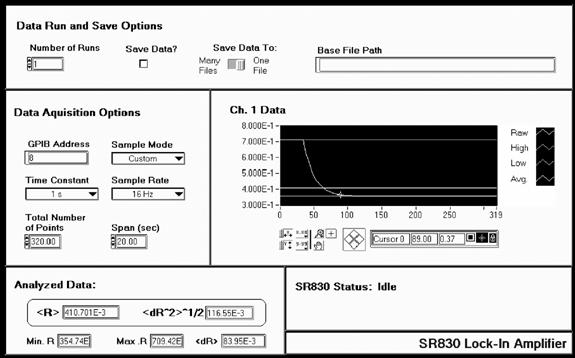
- When the program has plotted the data, you may see a typical "RC" decay. From the graph, determine the time constant of the lock-in. Hint: using the cursor feature of the Interface program. To move the cursor, use the buttons that are in the shape of a rhombus.
- Note: the data are plotted as a (signal value) vs. (data point number) and not (signal value) vs. (time). However, it is easy to convert from a bin number to a time-each bin represents a time interval of $\frac{1}{Sample Rate}$.
- To make another data transfer you do not need to restart the program. There are two choices. One, click on the arrow in the upper left corner (note: this arrow only shows up if you have already done a transfer of the data at least once.) Another choice is to choose [ RUN ] from the OPERATE menu option.
- Explore different values for [ SLOPE/OCT ] for different values of the [ TIME CONSTANT]. Do you see a pattern in the effective time constant? Is the effective time constant given by the ENBW? (see p. 3-21 of the SR830 Basics section.)
Experiment IV
This is basically an extension to Experiment III. You're going to determine how quickly you can track a signal given and what thing you'll need to take into consideration when determining the proper time constant and [slop/oct] settings.
- Follow the procedure for Experiment III up until number 6)
- Instead of using the settings in 6) of Experiment III, input the following settings:
- GIPB ADDRESS: 8
- SAMPLE MODE: Best Choice
- TIME CONSTANT: 100 milliseconds. This sets the SPAN to 9 ms. Now, change SAMPLE MODE to Custom and TIME CONSTANT to 1s (remember we are doing this because there is a bug in the program).
- SAMPLE RATE: 128 Hz
- Press [ START ]
- Every 1/2 second or so, toggle the amplitude of the input sine wave between 2 Vpp and 1 Vpp (note: you only need to do this for the 9 seconds that data is being acquired).
- Is the data an accurate representation of how the amplitude of input signal was changing? Explain.
The SR570 Low-Noise Current Preamplifier
The SR570 Low-Noise Current Preamplifier, with the 1000 ohm 1% resistor across the input terminal, converts an input current signal to a voltage signal without adding much noise (we will use the SR570 to boost the signal from the PIN10-DP Pin Diode later in the lab). The operation of the SR570 is relatively simple. The following exercises are meant to get you aquatinted with the basic operation of the device. Before continuing, you should read the following from the SR570 Operating Manual:
- Introduction Section (p.1)
- Operation and Controls (Front Panel Operating Summary section (p.p. 3-6)
- And the Verifying Specifications section (p. 5)
A few things to note:
- The input current should produce an output voltage of 1V or less
- The source used for measurements should have an impedance greater than $\frac{1}{sensitivity}$
- For best performance, the SR570 should be warmed up for one hour before use
Experiment V
A brief introduction to the workings of the SR570
- Turn on the SR570. If we were interested in achieving the best performance using the SR570, we would let it sit and warm up for an hour at this point. However, since we are just getting an idea as to how it works, we won't concern ourselves about letting it warm up.
- Use a DMM to measure the current being put out by the DP-10 Pin Diode (use the DC setting). (Note: the DMM will attempt to measure what it thinks to be an RMS value for the current.)
- Adjust the settings on the SR570 as follows:
- FILTER TYPE: None (We won't worry about filtering the output signal, right now)
- GAIN MODE: Low Noise (See the operating manual for more information about gain modes.)
- SENSITIVITY: Roughly X100 (A/V (This is basically gain. Remember, the pre-amp converts a current to a voltage, this just specifies the inverse of the resistance. Thus, the lower the sensitivity, the higher the gain. Output on the DMM is 1 Volt or less)
- BIAS VOLTAGE: Off (i.e., the "on" position is not lit up)
- INPUT OFFSET: Off (i.e., the "on" position is not lit up)
- Hook up the OUTPUT of the DP-10 Pin Photodiode to the INPUT of the SR570 and measure the output voltage Vout of the SR570 on the DMM. Does the DMM Match this value?
A few notes about the Filters:
Suppose you have a signal that contains so much noise at a known frequency or range of frequencies (e.g. 60/120 Hz noise) that any amplification of it would overload either
- The SR570 itself or
- The input of an instrument that you plan to hook up to the OUTPUT of the SR570.
It may be in your best interest to eliminate this extra noise as much as possible. That's one of the uses of the various filter options on the SR570.
If the Gain Mode is set to Low Noise, the filtering happens after the amplification. If the Gain mode is set to High Bandwidth, the filtering occurs before the amplification. However, using a high bandwidth gain has a disadvantage over the low noise gain in that it introduces more noise (see p. 8 of the SR570 Operating Manual). Keeping these things in mind, which Gain setting would you use to cure the two different problems described above?