MUO - Analysis in ROOT
Here we give some examples for how to analyze the Muon Decay data in ROOT. ROOT is a data analysis package, specifically designed for processing large datasets, advanced statistical analysis and fitting. It uses C++ as internal interpreted macro language, so if you have programmed in C, C++, or C#, it should be straightforward to learn ROOT. For more information on ROOT, including tutorials, User's Guide, or to download the executable for Linux, MacOS, or Windows, visit http://root.cern.ch
Calibration Analysis
Here is a sample macro to process the calibration data (see MUO- Calibration of Electronics). You can save the code into an ascii file (e.g. muCalibRaw.C) and execute it with .x muCalibRaw.C . Or, cut-n-paste commands between {} brackets into the ROOT command-line prompt.
//
// Sample ROOT macro to analyze the time calibration data
// Replace the file name "MUO_Calib_raw.txt" with your unique file name
// You may also need to adjust cuts on v1 and v2
//
{
  // create an "ntuple": a tabular data structure with 5 columns
  TNtuple ntpC("ntpC","ntpC","dt:v1:w1:v2:w2");

  // read the data from the file. The file should contain only numbers,
  // i.e. you should remove any header information
  ntpC.ReadFile("MUO_Calib_raw.txt");

  // require statistics to be printed (entries, mean, RMS)
  // require fit information (parameters and chi2/df)
  gStyle->SetOptStat(1110);
  gStyle->SetOptFit(1111);

  // plot the distribution of pulse heights
  TCanvas* c1 = new TCanvas("c1","v1");
  ntpC.Draw("v1");

  TCanvas* c2 = new TCanvas("c2","v2");
  ntpC.Draw("v2");

  // it seems that the pulse signal is around v2=0.6. Plot dt for these events
  TCanvas* c3 = new TCanvas("c3","dt");

  // convert dt to microseconds. Plot with error bars
  ntpC.Draw("dt*1e6","v2>0.55&&v2<0.6&&v1>0.5&&dt<40e-6","e");

  // fit over the same interval you would use in the analysis of the real data
  htemp->Fit("expo","","",2,38);

}
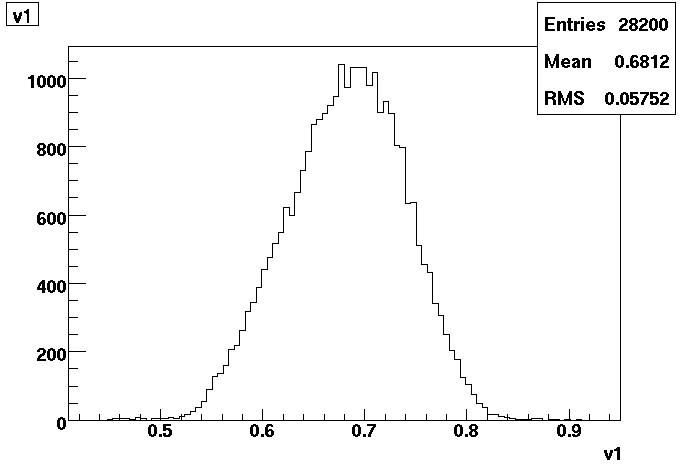
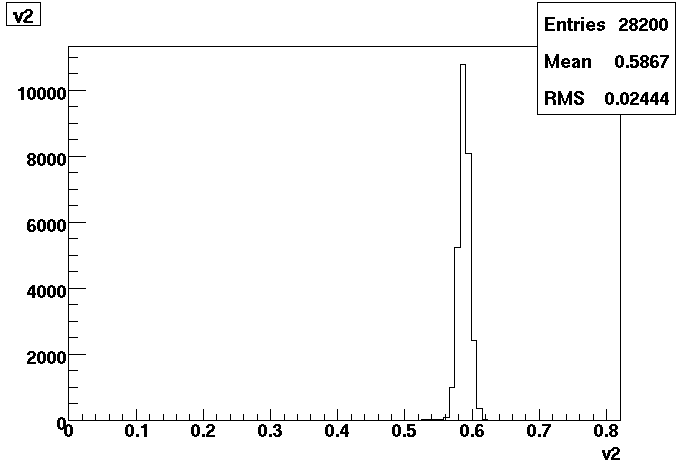
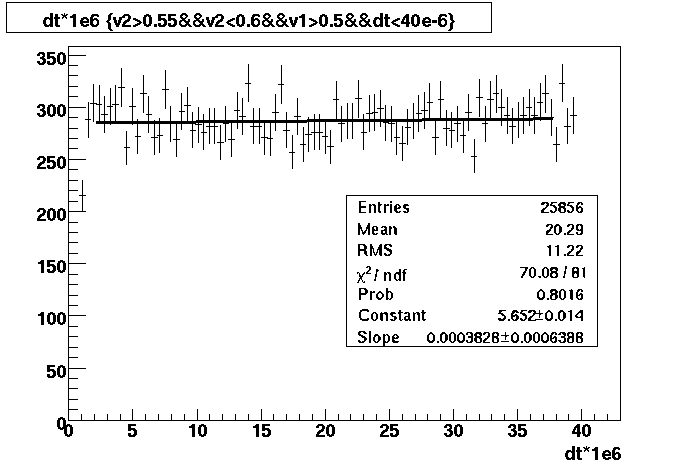
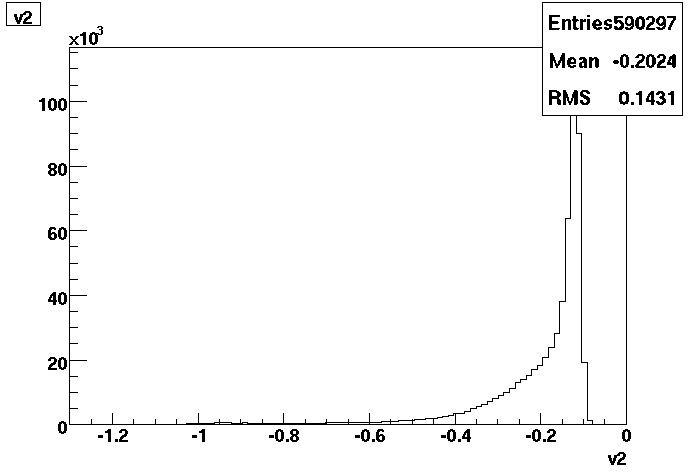
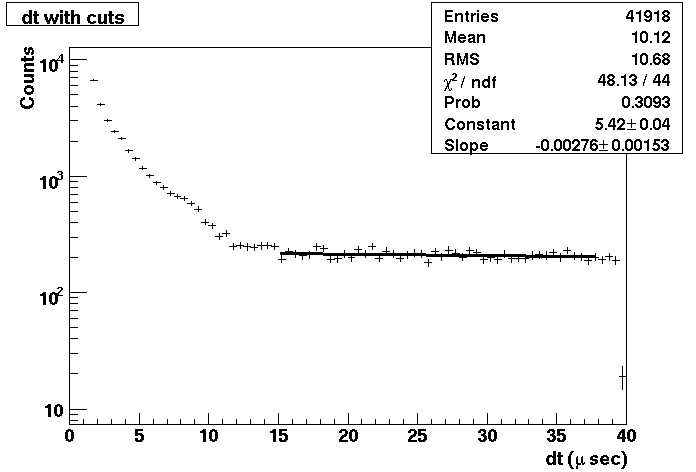
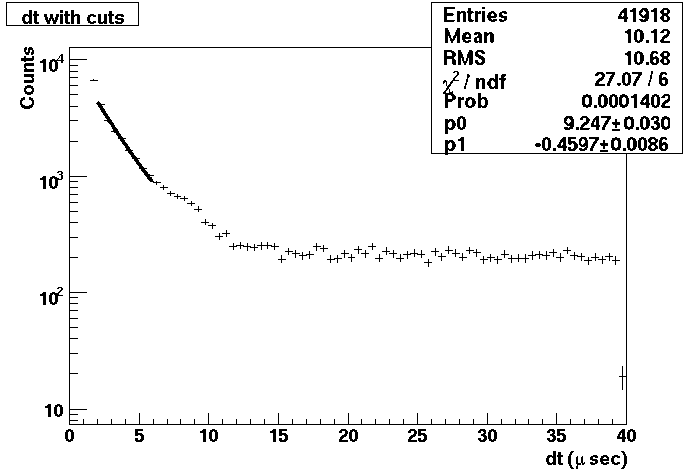
Graphical output of this macro is shown below. The last plot shows the exponential fit to the dt distribution.
Muon Data Analysis
Here is a sample macro to analyze the raw muon decay data. You can save the code into an ascii file (e.g. muAnalysisRaw.C) and execute it with .x muAnalysisRaw.C . Or, cut-n-paste commands between {} brackets into the ROOT command-line prompt.
//
// Sample ROOT macro to analyze the time  data
// Replace the file name "MuonData.txt" with your unique file name
// You may also need to adjust cuts on v1 and v2 and other details
// This macro does not attemp to fit the entire distribution of dt
// at once; the full fit would have to include 3 functions: muon decays,
// the ion peak, and the background. This is left as an exercise for the
// reader
//
{
  // create an "ntuple": a tabular data structure with 5 columns
  TNtuple ntpR("ntpR","ntpR","dt:v1:w1:v2:w2");

  // read the data from the file. The file should contain only numbers,
  // i.e. you should remove any header information
  ntpR.ReadFile("MuonData.txt");

  // require statistics to be printed (entries, mean, RMS)
  // require fit information (parameters and chi2/df)
  gStyle->SetOptStat(1110);
  gStyle->SetOptFit(1111);

  // plot the distribution of pulse heights
  TCanvas* c1 = new TCanvas("c1","v1");
  ntpR.Draw("v1");

  TCanvas* c2 = new TCanvas("c2","v2");
  ntpR.Draw("v2");

  // create a new canvas with log scale
  TCanvas* c3 = new TCanvas("c3","dt");
  c3->SetLogy(1);

  // it seems that the data at low v1 and v2 is noise. Reject it with
  // a cut on v1 and v2. Remove data at low dt (garbage)
  // convert dt to microseconds. Plot with error bars in a dedicated
  // histogram (80 bins from 0 to 40 usec)
  TH1F* muonHist = new TH1F("muonHist","dt with cuts; dt (#mu sec); Counts",
			    80,0,40);
  ntpR.Draw("dt*1e6>>muonHist","v2<-0.2&&v1<-0.6&&dt<40e-6&&dt>1.5e-6","e");

  // fit background region first
  muonHist->Fit("expo","","",15,38);
  muonHist->Draw("e");

  // record parameters
  float p0b = muonHist->GetFunction("expo")->GetParameter(0);
  float p1b = muonHist->GetFunction("expo")->GetParameter(1);

  // now create another fit function: two exponentials
  TF1* twoExp = new TF1("twoExp","exp([0]+[1]*x)+exp([2]+[3]*x)");

  // fix the last two parameters to the value from the background fit
  twoExp->FixParameter(2,p0b);
  twoExp->FixParameter(3,p1b);

  // set initial guess for muon decay constant
  twoExp->SetParameter(1,1./2.2);

  // now fit the muon decay data. Ignore the region where the ion "bump"
  // is present. Do it in a separate canvas
  TCanvas* c4 = new TCanvas("c4","dt");
  c4->SetLogy(1);
  TH1F* muonHist2 = (TH1F*)muonHist->Clone();
  muonHist2->Fit("twoExp","","",2,6);
  muonHist2->Draw("e");

}

