MUO - LabView Programs Controlling NI Digitizer
All pages in this lab
- Muon Lifetime Lab Write Up
- Exponential Probability Distributions
- LabView Programs Controlling NI Digitizer
|
Jump to: |
Muon Lifetime - LabView Programs Overview
There are two programs that control the NI digitizer that you will need to use for this experiment. First, you need to use the ViewSignals program, which shows you what the signals (from the PMTs) look like raw out of the digitizer and after filtering. This will help you select appropriate settings for the data collection program, Muon Detection Program. After you have determined the pulse characteristics and optimal settings, you can stop acquisitions for ViewSignals and start collecting your data with “Muon Detection Program 3.0.” See below for description of program.
There are shortcuts for these two programs on the Desktop of your lab station computer. The two programs can NOT be running both at the same time, since they use the same hardware.
NOTE:
When you want to stop the program, there is a sequence to stop or you will lose the last part of your data, and no data will be copied to the network file. You can set the progressive save time to the local file by changing the "Save After" time. To save all your data when you stop a run early, you must first push the Stop acquisition early button once, then go to the top menu and push stop, the Red button of the main program. If you allow the experiment duration to elapse completely, or follow this stopping sequence, the program will automatically save the last of your data to the local file and copy the completed local file to the network file.
Description of Muon Programs and Setup
ViewSignals
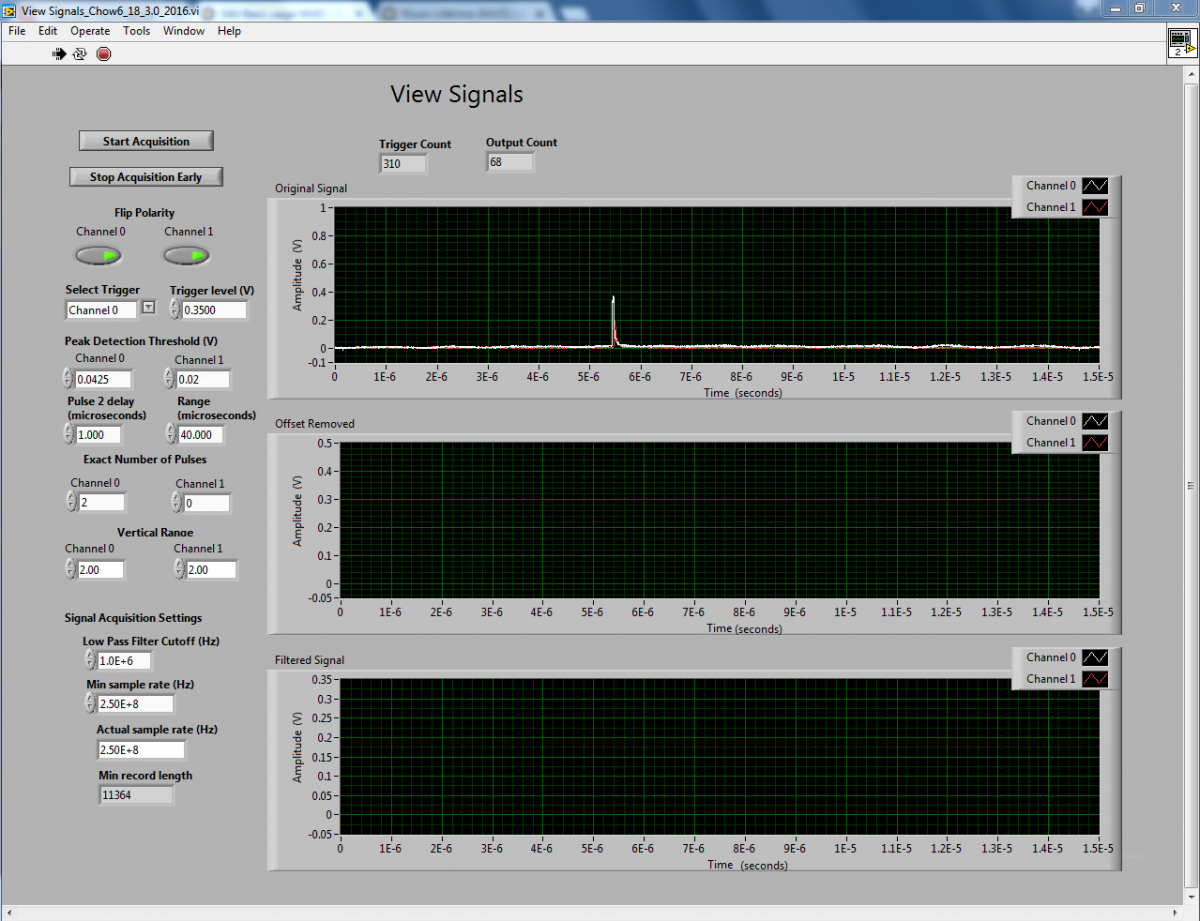
The ViewSignals.exe allows for calibration before data acquisition is initiated. In this program, a raw signal is imported from the data acquisition card. The offset is then removed from the signal and it is run through a low pass filter to clean up the data. The front panel has graphs for viewing the signals raw, with offset removed, and with offset removed + filtered. Click here to view the ViewSignals front panel.
These are the various controls and indicators in this Vi:
Flip polarity (Ch0 and Ch1) – Controls – Tell the vi whether the pulse amplitudes are positive or negative. For negative pulses, the edge triggering is set for a negative slope. For positive pulses, the edge triggering is set for a positive slope. The pulse polarity control is also necessary for threshold detection, amplitude, and width measurements. This is set independently for each channel.
Select trigger - Control - Tells the digitizer which channel to trigger on, Channel 0 or Channel 1 (or external, which we do not use)
Trigger level (V) – Control – Tells the digitizer the trigger level relative to the ground, not to any possible offset. When the trigger condition is met, the digitizer takes a record and passes it to the Vi for processing.
Trigger count - Indicator - Number of times the digitizer's trigger condition has been met, initiating the passing of a record to the Vi.
Min sample rate (Hz) – Control – Tells the digitizer the minimum sample rate. The maximum rate at which the digitizer can sample is 2.5x10⁸ Hz. The digitizer will sample at a rate equal to or greater than the set minimum sample rate.
Actual sample rate (Hz) – Indicator – The actual sample rate. (Usually equal to the minimum for our purposes, see NI documentation for when it would be different)
Range – Control – Time (in microseconds) spanned by each record from the digitizer. The program will calculate the minimum number of samples for the digitizer to acquire in each record using this value and the sample rate.
Min record length - Indicator - Shows the minimum record length (calculated from range and sample rate)
Peak detection threshold (V) (Ch0 and Ch1) – Controls – Sets the voltage threshold for a pulse to be considered a pulse. A signal must exceed this threshold (be less than this threshold for negative polarity, be greater than this threshold for positive polarity) to be counted. This voltage is relative to any (possibly drifting) offset the signal may have. This is set independently for each channel.
Pulse 2 delay (microseconds) – Control – Sets the minimum time after the first pulse occurs that a following signal may be counted as a second pulse. This delay can be used to ensure that no characteristic of the first pulse is mistakenly counted as a separate, second pulse.
Exact number of pulses (Ch0 and Ch1) - Controls - Sets the exact number of pulses needed to be detected in each channel in a record to increase the output count by one.
Output count - Indicator - Shows the number of records from the digitizer that had peaks that matched the desired quantity and quality.
Vertical Range (V) (Ch0 and Ch1) - Controls - Sets the voltage range used for acquisition. Levels set independently
Lower cut-off frequency (Hz) – Control – Sets the cut-off frequency of the low-pass filter. Once the data appears to come in cleanly and accurately, Muon_Detection_Program3.0.exe may be used to record pulse information.
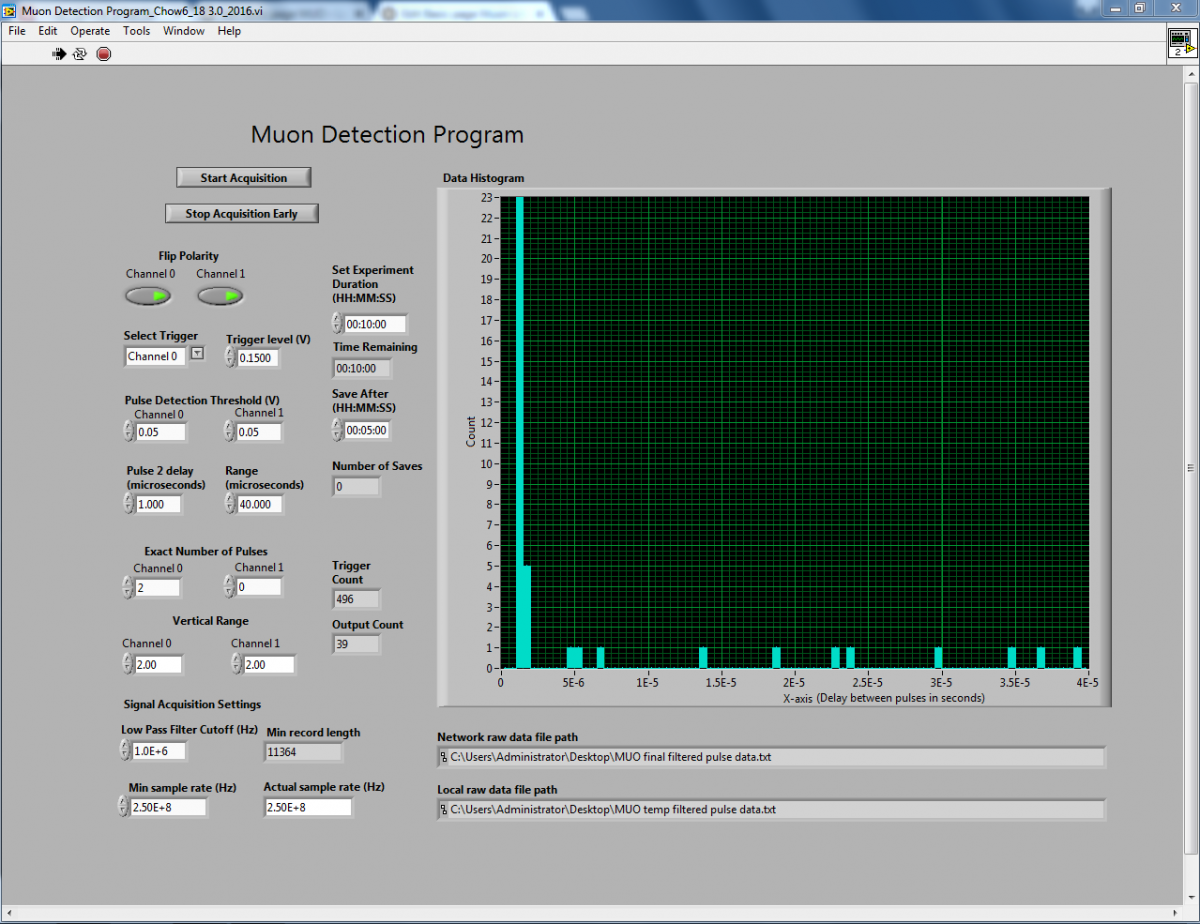
Muon Detection Program
Muon_Detection_Program3.0.exe is very similar to the ViewSignals. The pulses that can be seen in ViewSignals are what this program "sees" and uses for creating your data file. The program tells the digitizer to acquire data using Channel 0 and Channel 1, with a user-set "record" length and trigger level. Again, record length is calculated using range and sample rate. The digitizer then waits for the trigger condition to be met (looks for one pulse above the trigger level). When the trigger condition is met, the digitizer passes one "record" to the vi. (Note, the start of the record is set to be 12% of the range before the trigger.) The vi then detects all of the pulses in the record above a user-set threshold for each channel, and compares the number and quality of pulses in each channel to the user-input desired amount. We will look for two pulses, the second of which must come at a time greater than the user-set "pulse 2 delay" beyond the first (and less than the range away, which is controlled by the record length of the digitizer). If two such pulses exist, the vi records the time from the start of the record, amplitude, and width of both peaks. The time information is taken off the signal before it is passed through a low-pass filter. The amplitude and width information is passed after the signal is passed through a low-pass filter. The width is the full-width-half-max. The information from each record is stored in an entry of the following format: (time 1, amplitude 1, width 1, time 2, amplitude 2, width 2).
The vi acquires data and looks for pulses for a user-input "Set Experiment Duration" time. During this acquisition time, a real time histogram of the time intervals between the two pulses is plotted on the front panel. Each time a progressive save interval has elapsed, the data, an array of all entries created since the last save, is saved to the local file. Once the total acquisition time has passed, the vi saves the last of the raw data and writes the output/trigger count to the local file. Then it copies the local file to a network file. Click here to view the Muon Detection Program front panel.
The program has all of the controls and indicators included in ViewSignals, and these additional controls:
Set Experiment Duration(HH:MM:SS) – Control – Set the total acquisition time, the time that the vi acquires data and analyzes it for pulses before finishing data saving to the local file, copying to the network file, and ending the program.
Save After (HH:MM:SS) – Control – Amount of time between each time the program stops making records briefly to save data to the local file.
Number of saves - Indicator - Shows the number of times that data has been saved to the local file
Start acquisition – Control – Begin taking data. This control prompts you to select two file paths to which to save the different data.
Stop acquisition early – Control – Stop taking data before the acquisition time is up. This control saves the last set of data and completes the same end procedure as if the Experiment Duration had elapsed.
Histogram graph – Indicator – This is a histogram of the time intervals between pulses for the whole run. (Updates every time output count increases)
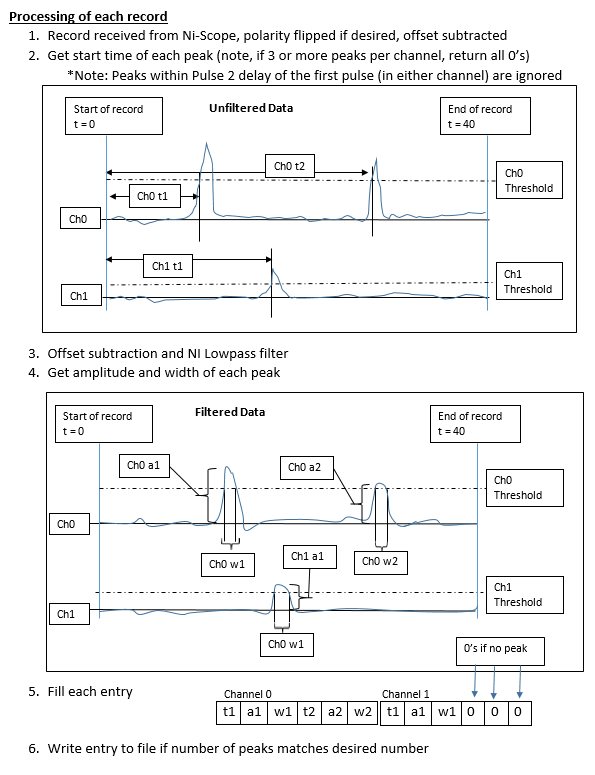
The following schematically shows the processing of one record:
SubVi's
Ni-Scope Package - This program uses several SubVi's from the Ni-Scope package. These are the vi's that will be used to configure the digitizer and acquire records from the it. Documentation can be found here. The vi we will use to actually take data is ni-Scope Read (poly). This vi will return one "record" each time the digitizer is triggered. Each record is formatted as clustered "waveform data" which contains:
- Relative time between the trigger and the first sample in the record (in seconds)
- x Increment between subsequent data points (in seconds)
- Indexed y values (an array of voltages in our case)
Configure Digitizer.vi - This vi creates a new IVI instrument driver session, configures properties of the digitizer vertical subsystem (vertical range, vertical offset), configures electrical properties of channel 0 and channel 1 (input impedance, maximum input frequency), configures properties of the horizontal subsystem (min sample rate, reference position), configures properties for edge triggering (slope, channel, trigger level), returns the effective sample rate, returns the actual record length, and returns the instrument handle. It interfaces with the digitizer using Ni-Scope vi's.
Create Files.vi - This vi prompts you to create or replace two files. One of the files is to be saved as temporary location on the local hard disk for data storage during a run. The other file is raw data to be saved on the network drive at the end of the run. If any of the prompts are canceled, all execution stops. It outputs the file paths for both files.
Format Raw Data File.vi - This vi takes some of the initial control values (Min sample rate, Min record length, Trigger level, Pulse 1 threshold, Pulse 2 threshold, Range, Pulse 2 delay, Lower-cut off frequency) and formats them into a spreadsheet string. This, along with a string for the pulse counts and a string that has the headers for the columns of the file, are outputted to be saved to the raw data file.
Subtract Offset.vi - This vi averages the first 200 point of a waveform and subtracts this value from each point of the waveform, outputting the new waveform. Note that this will be significantly before the first pulse in each record, so you will only be subtracting off the background with this Vi.
Threshold Detector.vi - This vi returns the beginning indices of peaks above a threshold. Documentation can be found here. We will use this vi to find all the peaks in each record.
Find Relevant Indices.vi - This vi returns beginning indices of the first peak and peaks that are separated by more than the "pulse 2 delay" from the first peak in the record. It literally takes an array of indices, a timing interval (dt), a pulse 2 delay (t2), and a first pulse index (n0). The array that it returns is the first pulse index if it appears in the input array, followed by all indices (n) that satisfy the condition that [(n - n0)*dt > t2]. Note that at this time, this process prevents you from using one combination that would be otherwise appropriate for data taking. For a muon that comes through the top tank, and stops and decays in the bottom, looking for 1 pulse from the top PMT and 2 in the bottom PMT will not work. This is because the pulse 2 delay will need to be set much longer than the time travel time between the two tanks.
Collect Relevant Data.vi - This vi takes a data array, timing increment, and beginning indices. It outputs peak time (relative to the start of the record), amplitude, and width (calls Filter, Amplitude and Width.vi) for two peaks. This vi's output is a 6 element array of (t1, a1, w1, t2, a2, w2). If there is only one peak in the waveform, (only 1 beginning index passed) then the time, amplitude, and width are set to 0 for the second peak. If there are no beginning indices passed, or greater than two, then all elements of the output array are 0. Time is found by multiplying the beginning index by the timing increment.
Filter, Amplitude and Width.vi - This vi takes inputs of this vi are an unfiltered signal, an index, a lower cut-off frequency, and a pulse polarity. It outputs an amplitude and a width. This vi filters only a subset of the unfiltered signal. The starting index of this subset is 50 indices before the inputted index. The length of this subset is 250 indices. The vi passes this subset through a low-pass filter with the inputted lower cut-off frequency as the cut-off frequency. After the filter, if the pulse polarity is negative, the vi takes the minimum value of the filtered signal and outputs it as the pulse amplitude. The vi takes the index, n, of this minimum value and looks at the voltages of previous indices, n-1, n-2,…, until it finds the first index, m, such that the voltage of m is greater than or equal to half of the (negative) pulse amplitude. The vi takes this index, m, the index the vi considered before it, m+1, and the voltages associated with these two indices, V(m) and V(m+1). The vi extrapolates between these points to find the value, l, such that V(l) = half the amplitude. The vi repeats this process for indices above n, and extrapolates another value, o, such that V(o) = half the amplitude. The vi converts these two values, l and o, into time values, and outputs the difference as the width. This width is approximately the full-width at half-max.
If the pulse polarity is positive, two things change. The vi takes the maximum value of the filtered signal and outputs it as the pulse amplitude. The vi looks for the first index on either side of the index of the amplitude such that the voltage of these indices is less than half the (positive) amplitude.
To see an example of a pulse before and after filtering, click here.
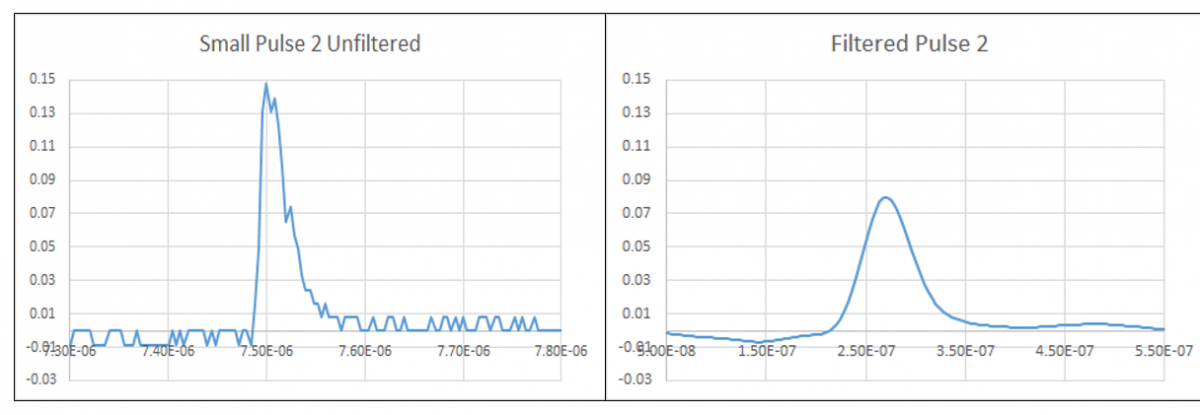
Create Histogram.vi - This vi creates the histogram array that will be used to store time intervals and plot them to the histogram graph.
Fill Histogram.vi - This vi fills the histogram based on the time interval between the two peaks from each entry. This is run each time the number of peaks exactly matches the user input amount.
View signals Defaults
The ViewSignals Program Defaults are as follows:
- Flip Polarity: On for both channels
- Select Trigger: Channel 0
- Range (microseconds): 40.0
- Pulse 2 Delay (microseconds): 1.0
- Trigger Level Relative to Ground: 0.3500 V
- Channel 0 Threshold relative to offset: 0.0425 V
- Channel 1 Threshold relative to offset: 0.02 V
- Exact number of pulses in Channel 0: 2
- Exact number of pulses in Channel 1: 0
- Vertical Range Channel 0: 2.00 V
- Vertical Range Channel 1: 2.00 V
- Minimum Sample Rate: 2.5 x 10^8 Hz
- Lower Cut-off Frequency: 1.0 x 10^6 Hz
Note that these are default values, and while they may get you in the right range, part of your job in this lab is to find optimal settings so that you get good data with the Muon Detection Program. Spend as much time as you need to do this part right, you don't want to set up for an overnight run collecting bad data.
Appendix: Muon Detection Program 3.0 Details
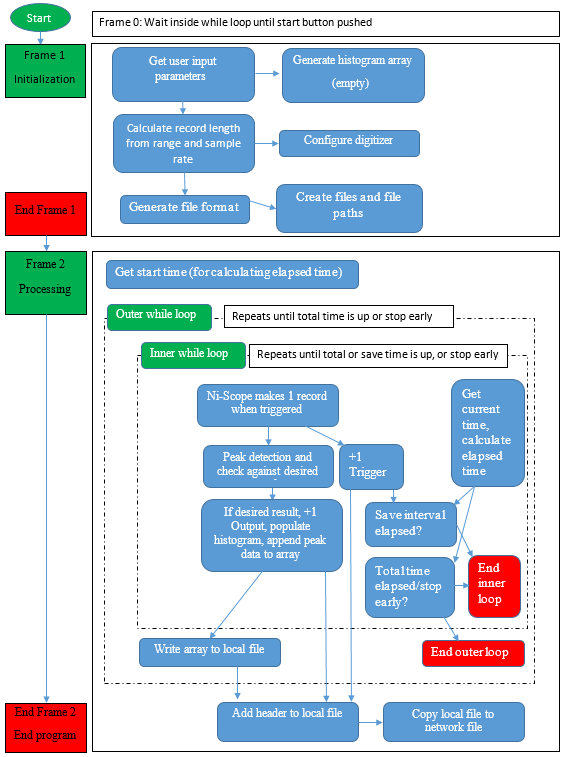
Initialization Frame
The outermost structure is a stacked sequence. The first frame (frame 0) contains only the start button which breaks a waiting while loop. Then the program moves on to the initialization frame (frame 1). The initialization frame reads most of the user inputs and calculates the minimum record length. This minimum record length is (Sample Rate * Range *10^-6). Note that the 10^-6 is because range is in microseconds. It then calls Configure Digitizer.vi, Create Histogram.vi, Format Raw Data File.vi, and Create Files.vi, and passes all information to the processing frame. Configure digitizer.vi sets the trigger condition, acquisition channels, impedance, and record length of the digitizer. The trigger condition is set by the "Select Trigger", "Flip Polarity", and "Trigger Level" user inputs. "Select Trigger" determines the channel that is triggered on, "Flip Polarity" sets the rising or falling edge type triggering and whether the trigger level is positive or negative, and "Trigger Level" sets the level required for triggering. Channels 0 and 1 are used for acquisition, and both have impedance set to 50 Ohms. Record length is equal to ("Sample Rate" * "Range" * 10^-6).
Processing Frame
The processing sequence (sequence 2) is where all of the data acquisition and processing happens. It is both the most complex frame, and the most important for understanding how the code works. In this frame, there are two while loops, one nested inside the other. The inner while loop runs an iteration every time the digitizer's trigger condition is met, and the trigger count increases by one each time. This is where the record from each trigger is analyzed for number of pulses, and pulse information is stored if it meets the pass requirements. The outer while loop is for progressively saving data to the local file, at user specified time intervals. "Trigger Count", "Output Count", and "Number of Saves" are all initialized as 0 before the start of the outer while loop, and passed through both while loops using shift registers.
Timing Coordination
The following is the timing coordination of this frame:
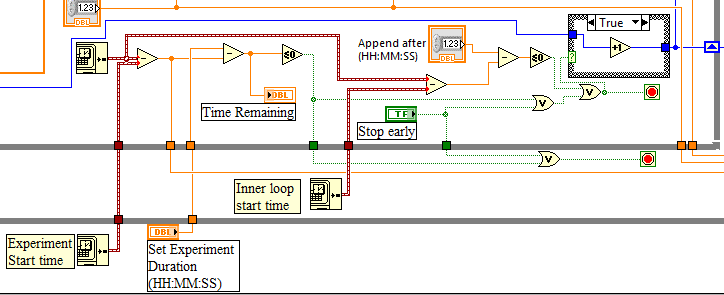
- Before the outer while loop runs, call Get Date/Time In Seconds Function, which gets the current time. This is the experiment start time
- When the outer while loop runs, call Get Date/Time In Seconds Function again. This is the inner loop start time
- When the inner while loop runs, call Get Date/Time In Seconds Function again. This is the current time.
- Inside the inner loop, subtract inner loop start time from current time. If it is less than the "Save After" time, end inner while loop (and increase "Number of Saves" by one).
- When the inner while loop ends, the outer while loop will run the next iteration. This will update the inner loop start time.
- Also inside the inner loop, subtract the experiment start time from current time. If it is less than the "Experiment Duration" time, then both loops end.
Data Acquisition and Processing (Inner While Loop)
The inner while loop of the processing frame has the niScope Read vi (which was already configured in the initialization frame by Configure Digitizer.vi). Each time niScope Read runs, it waits for the digitizer to be triggered. If the digitizer times out before acquiring a record, a dialog box appears telling you to check the signal, and all execution is stopped. The digitizer will not return a record if the trigger level is not met. If the digitizer is triggered, niScope Read outputs one "record" of set length (see Initialization Frame section). The output that we use from this vi is a cluster of "waveforms". A "waveform" itself is a cluster that contains the start time of the record relative to the trigger (double, but this will be unused anyway), the timing increment between two samples (double), and the signal, an array of evenly spaced voltage samples (double array). Since we use two channels, the output of niScope Read vi, is a cluster of clusters: cluster 0 is the "waveform" of channel 0, and cluster 1 is the "waveform" of channel 1. If the digitizer is triggered and there is an output, the waveform cluster is first separated into the waveform from each channel, and each channel's waveform is processed in parallel. This is how they are processed:
- First, the signal of each record is multiplied by -1 if the channel polarity is negative (handled by a case structure)
- The polarity-corrected signal is then is sent to Subtract Offset.vi
- The signal is then sent both to Threshold Detect.vi (and to Collect Relevant Data, but this requires more inputs, so I'll get to that a bit later)
- This returns the "beginning indices" of all peaks in the record
- After Threshold Detect.vi, beginning indices of peaks within the pulse 2 delay of the first peak are removed by Find Relevant Indices.vi. Thus it contains only the beginning indices of peaks that match all the pass conditions (above threshold, after pulse 2 delay, within record length/range). Note that the "first peak index" comes from the channel that the digitizer triggers on
- The output of Find Relevant Data (double array of relevant indices) is used in two ways: it is sent to Collect Relevant Data.vi, and its length of the array is compared to the number of pulses desired in each channel
- Collect Relevant Data determines the timing, width, and amplitude of each peak. It outputs the 6 element array for each channel which will be combined to form the data entry that may or may not be appended to the main data array, which will be written to file
- The length of Find Relevant Data's output will be used to determine whether or not data will be appended to the main data array.
After combining the Collect Relevant Data outputs from each channel into a 12 element array, the appending to data array and output counting are controlled by a case structure. If length of Find Relevant Data output is equal to the desired number of pulses in each channel, then the true case of the case structure executes. In the true case, the output count is increased by one, the time interval between the two pulses is calculated and added to the live histogram by Fill Histogram.vi, and the 12 element array is appended to the inner loop's main data array. This array is initialized as an empty array before the inner while loop starts, and is passed between iterations with a shift register. When the inner loop finishes, this main data array is appended to the local data file. In the false case, the output count, histogram, and main data array are unchanged. Outside of the case structure (so either way) the trigger count is increased by one.
Saving to Local File (Outer While Loop)
Outside the inner while loop, main data array (built of the 12 element entries) is converted into a spreadsheet string. Open/Create/Replace File function opens the raw data file on the local hard disk and appends the spreadsheet string to the end of the raw data file. It is then appended to the file. Appending to the file is accomplished by getting the file position and passing it through the outer while loop iterations using a shift register. Then, before writing to file, the file position is set at the end. Then the spreadsheet string is written to the file by the Write to Binary File function.
Outside the outer while loop, the header string is added to the local file. When the outer loop terminates, the local file is complete, and then the local file is copied to the network location specified when the program was initiated.
Muon Detection Program Flow Chart
Muon Detection Block Diagram
Click here to see the Start Frame
Click here to see the Initialization Frame
Click here to see the Processing Frame
Muon Lifetime (old)
= To use the Muon programs Description of Muon Programs and Setup Muon_Program_Description